

Summary
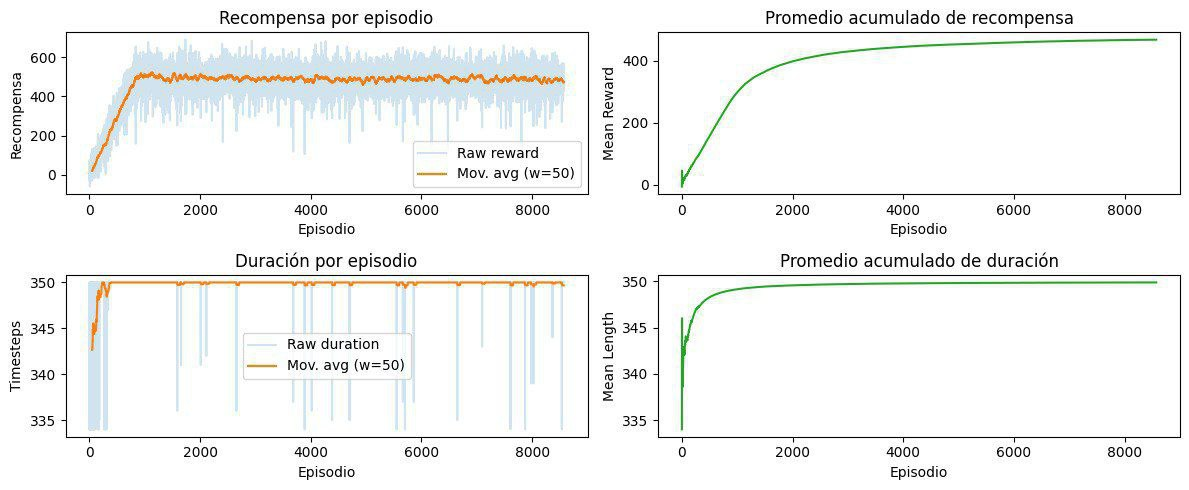
This regional project is building an ecosystem simulator where agents with different ecological roles learn to survive, compete, and adapt inside a shared environment. The approach combines deep reinforcement learning with Large Language Models (LLMs) to study how strategies for foraging, evasion, predation, and decision-making emerge in dynamic ecological settings.
The first phase focuses on a 2D multi-agent environment with resources and interaction rules. Herbivores and predators are trained inside that world to observe whether functional behaviors appear, measure performance across thousands of episodes, and document which patterns emerge through experience.
Beyond its value as an artificial intelligence testbed, the simulator is intended to become a practical platform for exploring ecological dynamics, agent communication, and future integrations with three-dimensional environments.
Work architecture
1. Environment
A simplified ecosystem is built with agents, food, water, and interaction rules to enable controlled experimentation.
2. Learning
Agents train survival strategies through deep reinforcement learning, adjusting behavior from reward feedback.
3. Interpretation
LLMs provide a future layer for reasoning, explanation, and natural communication so the system can describe why agents act the way they do.
4. Scaling
The roadmap includes exploring a 3D version with Minecraft and MineRL to assess richer and more complex interactions.
Observed emergent behaviors
Food seeking
One shared scene shows a peccary-like agent just before eating, suggesting that the agent is already recognizing a useful resource and executing a survival-oriented action.
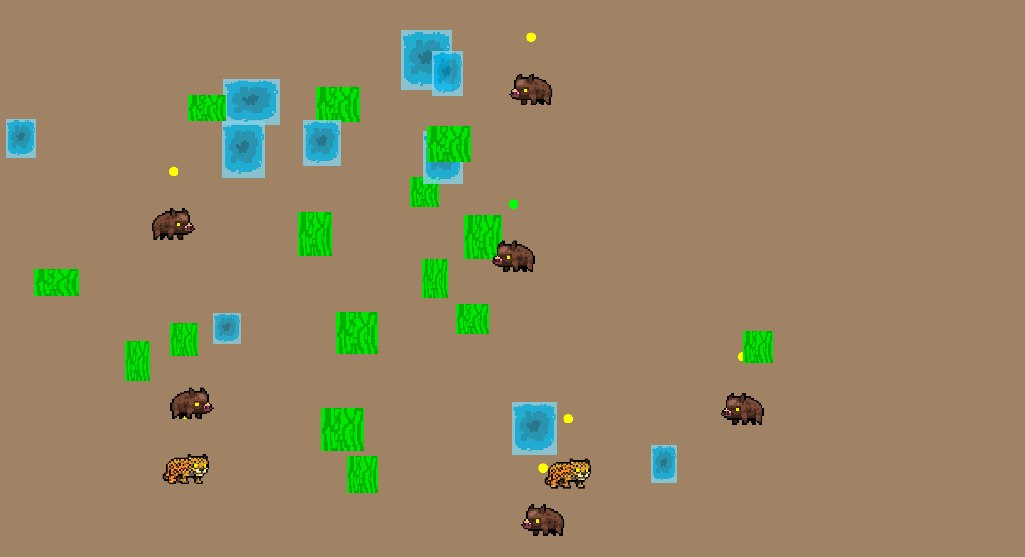
01-godot-comida-caza.jpg
Predator avoidance
Another visualization indicates that prey agents start changing their movement to move away from predators, a sign that training is producing adaptive responses beyond random motion.
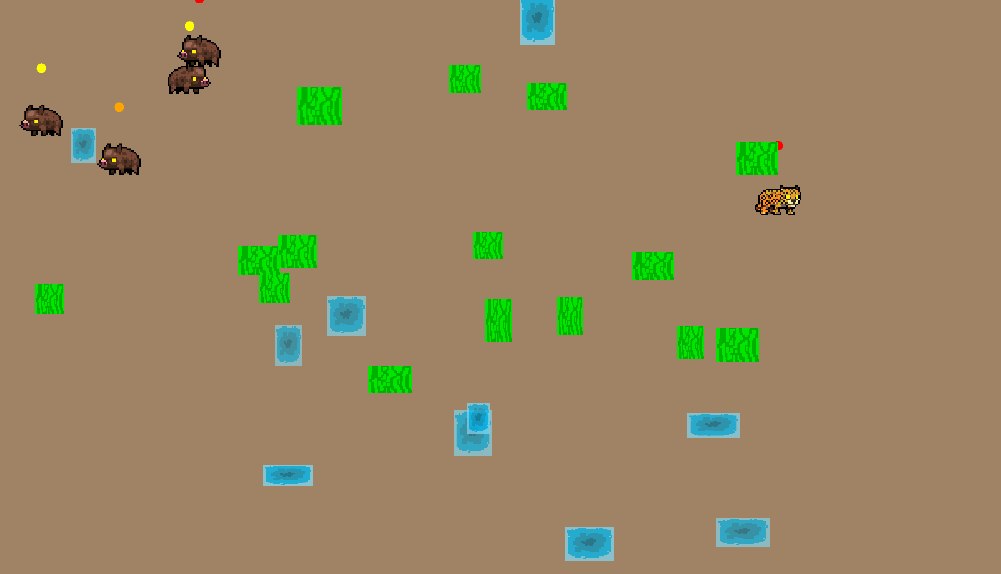
02-godot-evasion-depredadores.jpg
Simultaneous learning
A third scene brings both processes together: some agents improve their ability to find food while others learn to avoid threats in the same shared environment.
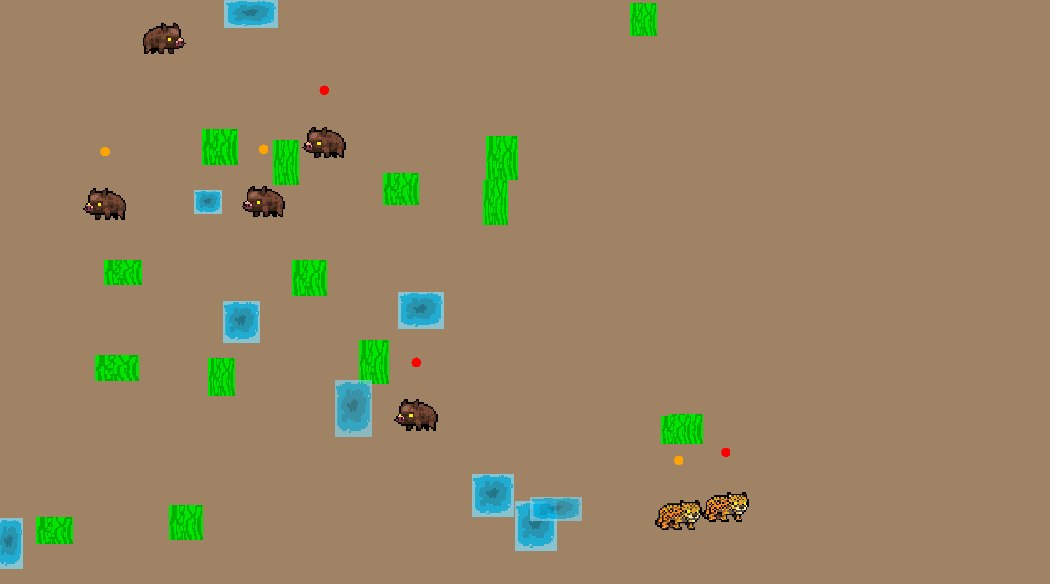
03-godot-comportamientos-juntos.jpg
Metrics and preliminary findings
Steady progress
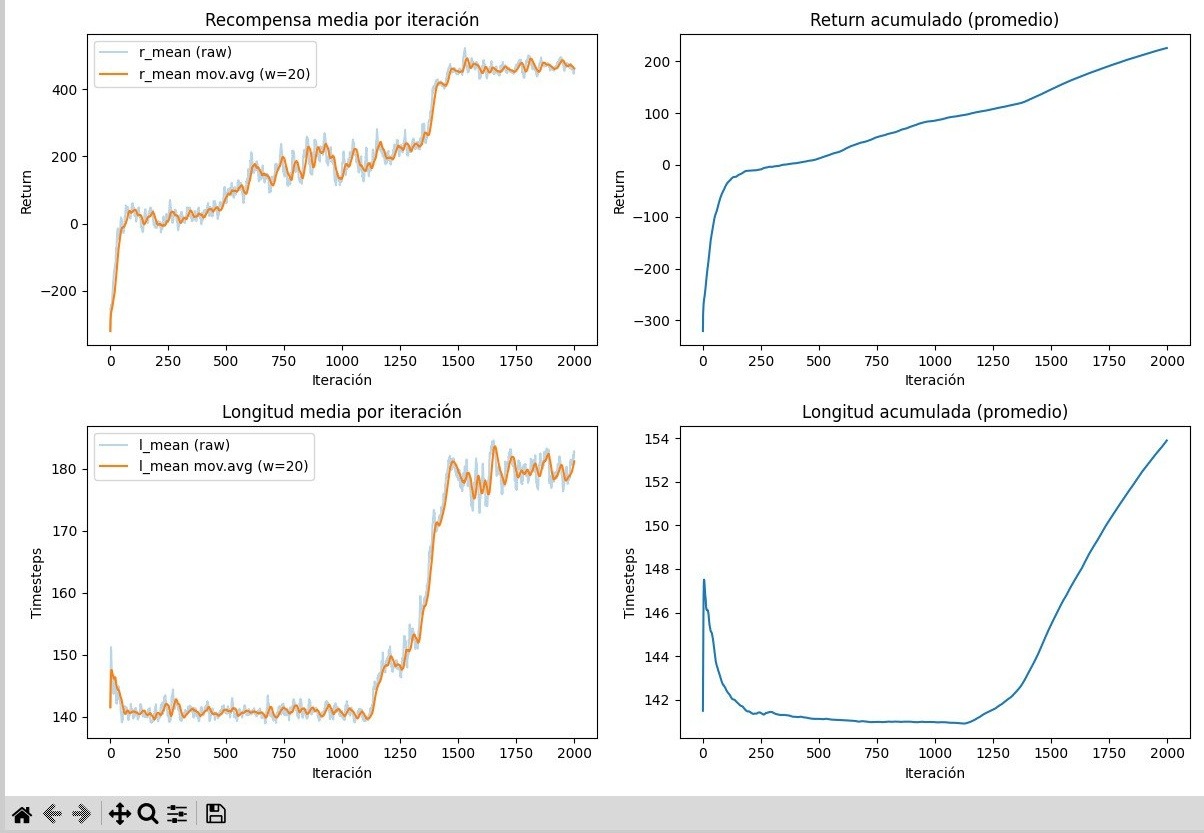
The training summary across 2000 episodes shows a clear improvement in overall agent performance, indicating that the system is learning more useful policies over time.
04-progreso-2000-episodios.jpg
Figure 1. The left panels show the per-iteration signal and its moving average, while the right panels summarize the cumulative average. When reward and episode length trend upward, the agents are improving over training.
Role-specific rewards
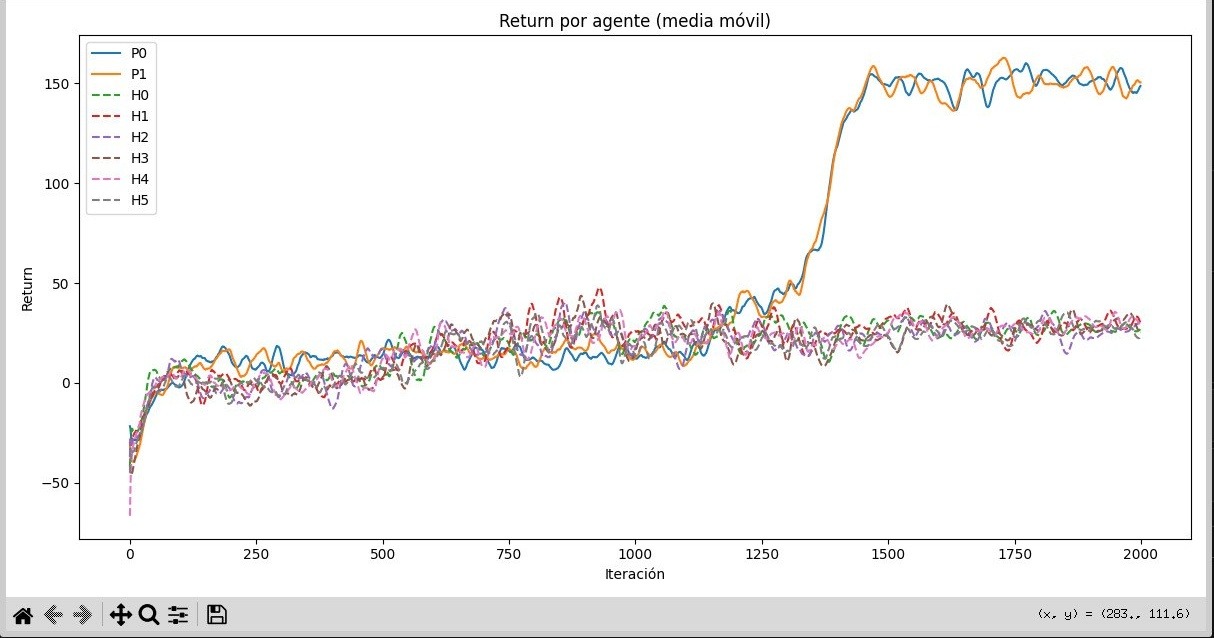
The return curves reveal distinct trajectories for herbivores and predators. Those differences suggest that both groups are discovering different strategies for maximizing rewards inside the ecosystem.
05-retorno-por-agente.jpg
Figure 2. Each line represents a different agent. Dotted lines correspond to herbivores and solid lines to predators; higher return means that agent earned more reward.
Current environment limit
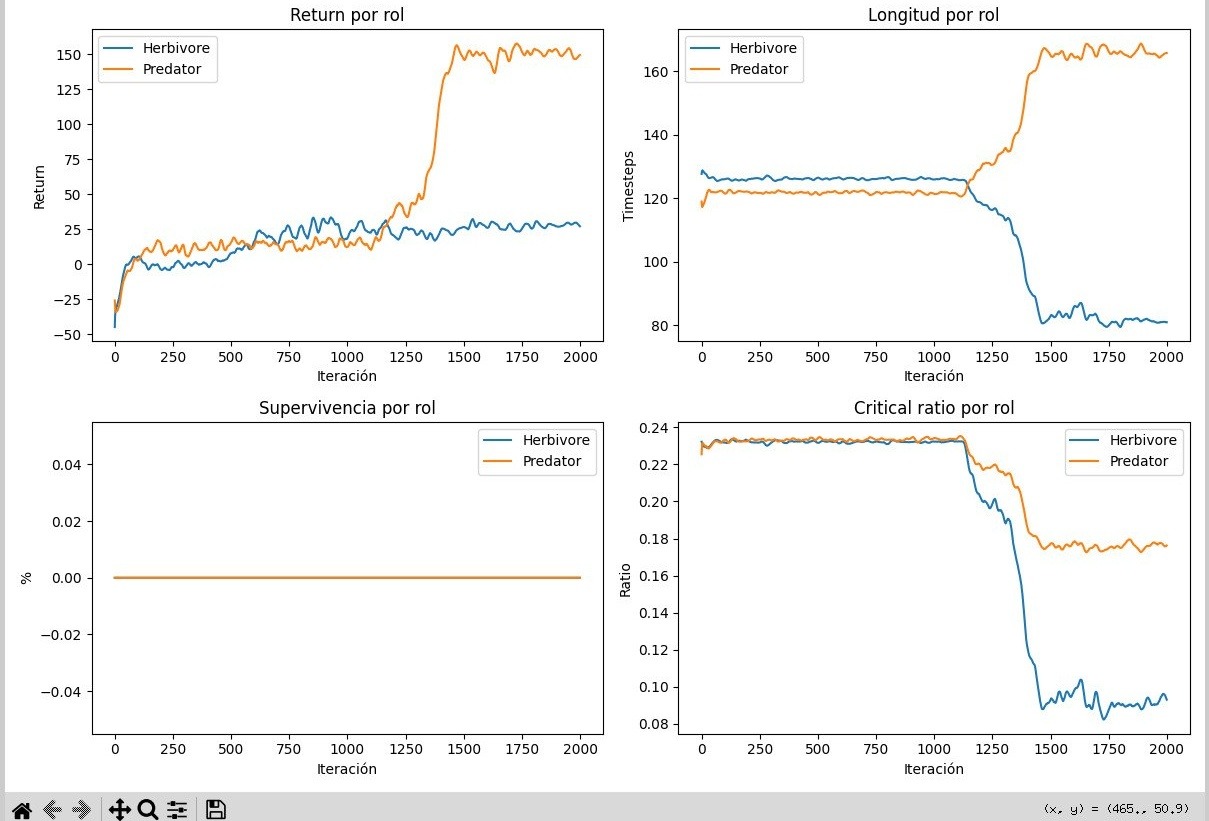
Role-specific survival remains below the full 350-step horizon in every episode, showing that the environment is still demanding and that learned policies still have room to improve.
06-supervivencia-por-rol.jpg
Figure 3. This figure compares return, episode length, survival, and critical ratio for herbivores and predators. The survival curve stays flat because no agent reaches the full 350-step episode limit at this stage of training.
Growing resilience
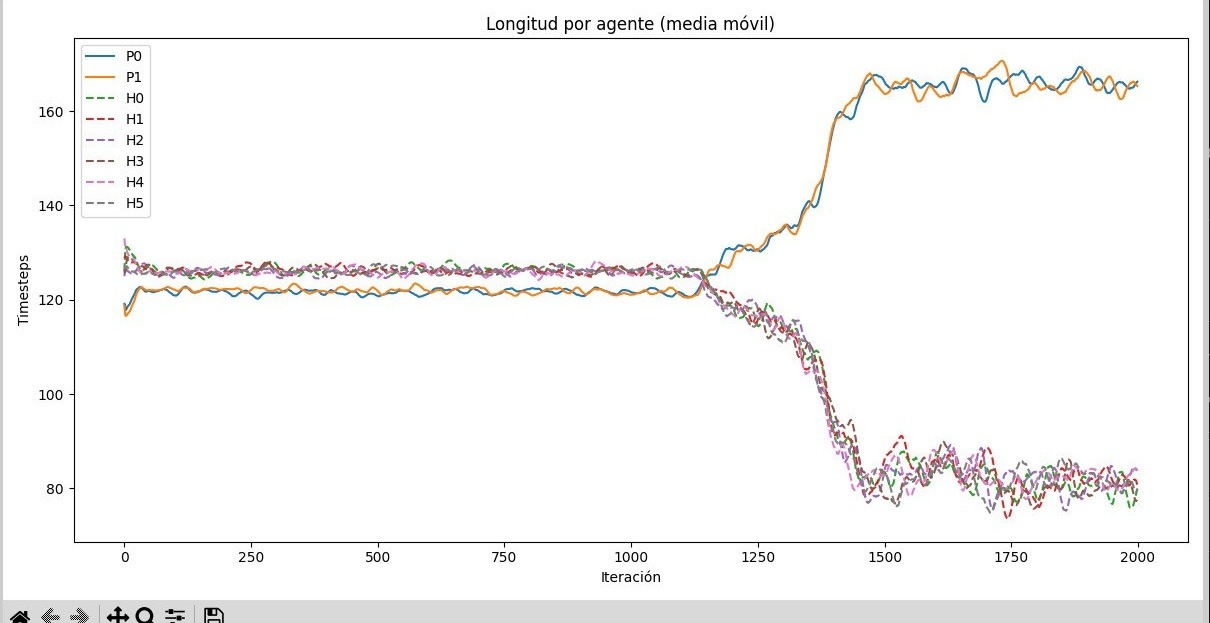
Agent episode length tracks how long each individual survives before dying. This metric helps separate real learning from gains that only appear in the reward signal.
07-longitud-por-agente.jpg
Figure 4. As in the return chart, each line represents one agent and the line style separates herbivores from predators. Higher values mean that the agent survived more steps before dying.
Changing ecological pressure
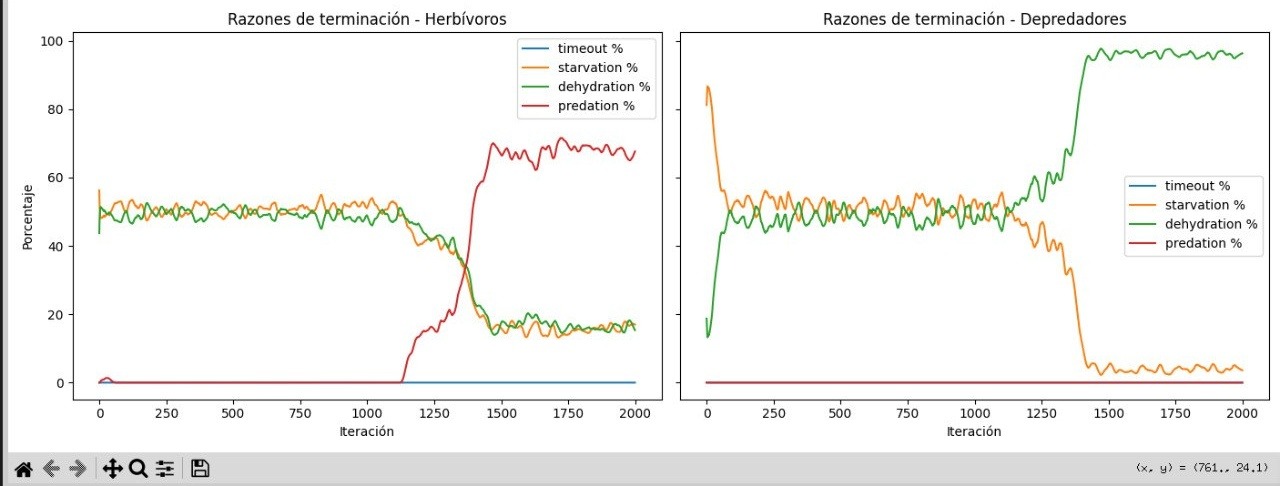
Herbivores initially die more often from hunger or thirst, but later predation becomes more common. For predators, lack of water becomes a stronger limiting factor than lack of food.
08-causas-de-muerte.jpg
Figure 5. Each panel corresponds to one role and each color marks a different termination cause. The highest curve at a given point shows the dominant cause of death in that part of training.
Predator food advantage
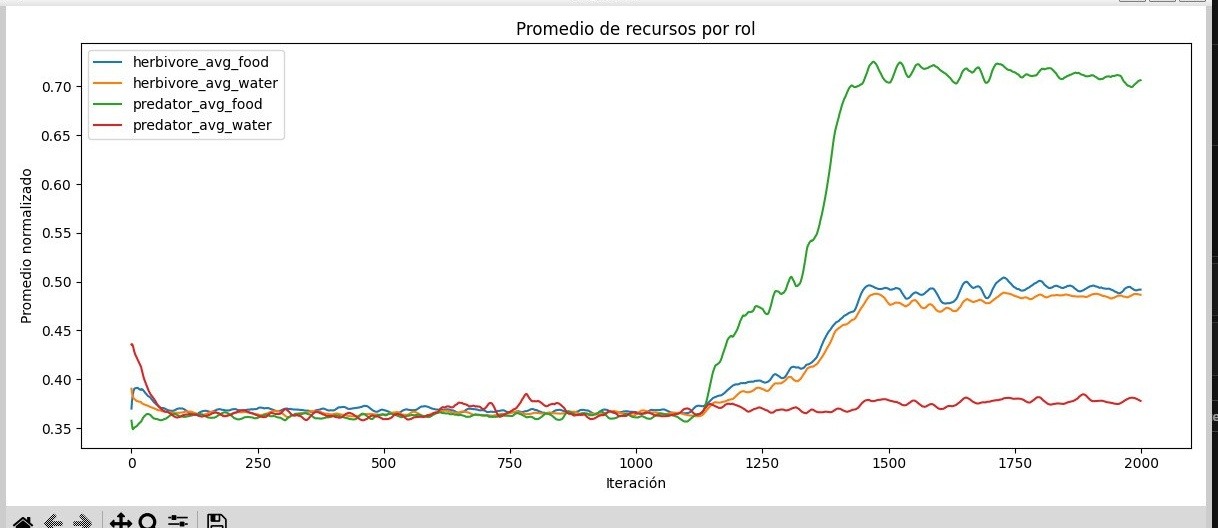
The average resource intake by role suggests that predators obtain food more easily, but consume very little water, which aligns with their later mortality patterns.
09-recursos-por-rol.jpg
Figure 6. The four curves compare normalized averages for food and water across both roles. A higher line means that group obtained more of that resource during the episodes.
Tactical activation threshold
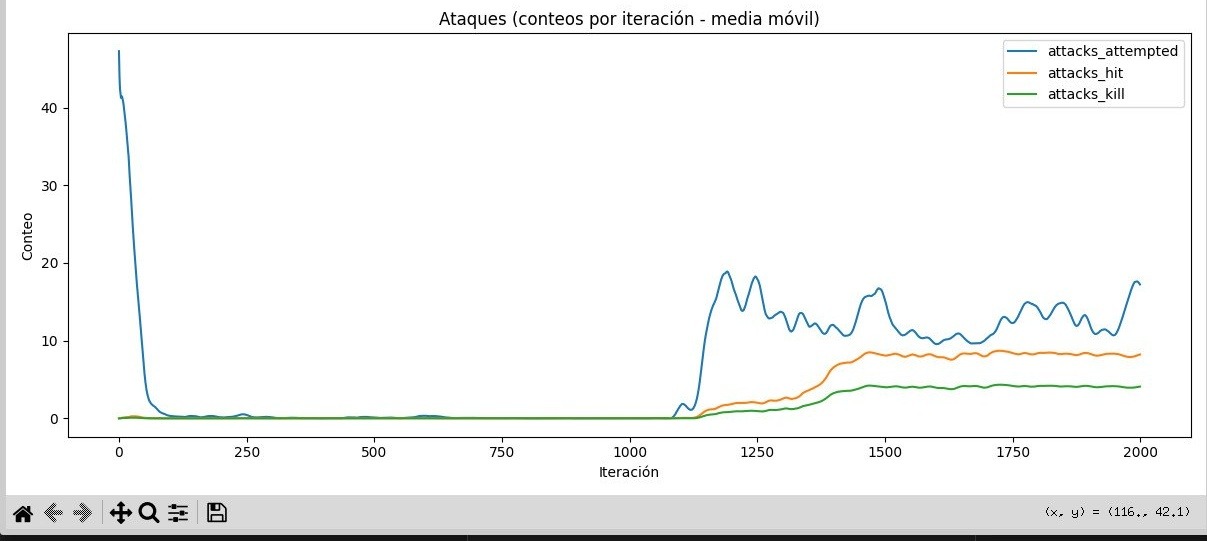
From roughly iteration 1100 onward, the number of predator attacks increases noticeably. That shift is consistent with the emergence of more active hunting behaviors in the other metrics.
10-ataques-por-episodio.jpg
Figure 7. The blue line counts attempted attacks, the orange line counts successful hits, and the green line counts attacks that ended in a kill. The jump around iteration 1100 suggests a clear shift in hunting behavior.
Next stage
The next phase includes enriching the environment, refining reward structures, incorporating LLM-generated explanations to interpret agent decisions, and evaluating a transition to 3D scenarios with Minecraft and MineRL. That step would open the door to more complex interactions, advanced spatial navigation, and richer forms of cooperation or competition.